For business owners evaluating a sale, investors exploring acquisitions, and entrepreneurs building companies worth buying, understanding how LBOs work isn't optional knowledge — it's foundational. The structure determines who wins in a deal, what financing is available, and whether a transaction closes at all.
This guide covers the full picture: LBO mechanics, the financing stack, what makes a strong candidate, the real risks involved, and why traditional banks rarely participate — replaced instead by a growing ecosystem of private and alternative lenders.
Key Takeaways
- LBOs use 50–70% debt (historically) to finance acquisitions, amplifying buyer returns on a smaller equity base
- The target company's own assets and cash flows serve as debt collateral — making cash flow stability the single most critical factor
- PE firms, management teams, and investor groups execute LBOs; traditional banks rarely lead the financing
- Value creation comes from three drivers: debt paydown, operational improvement, and exit multiple expansion — each compounding the other over the hold period
- Private debt funded 77% of global LBO financing in 2024, a decade high, with banks covering the remaining 23%
What Is a Leveraged Buyout (LBO)?
A leveraged buyout is an acquisition where the buyer finances the majority of the purchase price with debt, using the target company's assets and future cash flows as collateral, rather than committing large amounts of equity upfront.
The math is straightforward. A buyer acquires a company for $40 million using $28 million in debt and $12 million in equity, then sells it for $60 million after paying down $10 million in debt. The equity return is calculated on that $12 million base, not the full purchase price. Modest business growth translates into outsized returns — which is why LBOs remain the dominant structure in private equity.
LBO Variants Worth Knowing
Not every LBO involves a private equity firm writing a large check. The three most common formats:
- Standard LBO — A financial sponsor or PE firm acquires a target company using a leveraged capital structure; the most common format in institutional deal flow
- Management Buyout (MBO) — The existing management team acquires the business from current owners, typically backed by a PE sponsor or private lender
- Owner Buyout (OBO) — An existing owner monetizes a portion of their equity while retaining operational control and participating in future upside
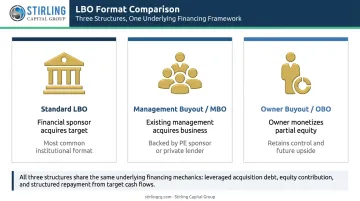
Each format uses the same underlying financing mechanics. The key differences are post-close control and how equity incentives are allocated among stakeholders.
How Does an LBO Work? A Step-by-Step Breakdown
Step 1 — Entry Valuation
Buyers calculate purchase price using an entry multiple — most commonly EV/EBITDA. In 2024, the average U.S. LBO purchase multiple was 11.0x EBITDA, according to PitchBook LCD data. That multiple sets the starting point for everything that follows: the total capital required, the debt load, and the return the buyer needs to justify the transaction.
Step 2 — Sources and Uses of Funds
Every LBO requires a sources-and-uses table that maps all capital needed against all capital available:
| Uses | Sources |
|---|---|
| Purchase price | Senior debt (term loans, revolvers) |
| Transaction fees | Mezzanine/subordinated debt |
| Financing costs | Sponsor equity |
| Working capital reserve | Seller financing (if applicable) |
Total sources must equal total uses. The equity contribution is the "plug" — the amount the buyer must fund after maximizing debt capacity. Minimizing that plug (while keeping leverage serviceable) is the central structuring challenge.
Step 3 — Post-Acquisition Debt Paydown
After closing, the acquired company's free cash flows redirect toward repaying debt tranches over a typical 5–7 year hold period. This process — called deleveraging — steadily increases the equity value in the business even if the company's EBITDA grows only modestly. Debt paydown alone is a return driver.
Step 4 — Exit
The three most common exit paths:
- Strategic sale — Selling to a corporate acquirer who pays a premium for synergies
- Secondary buyout — Selling to another PE firm, which has become increasingly common
- IPO — Taking the company public, typically reserved for larger, high-profile businesses
The exit multiple relative to the entry multiple determines a significant portion of overall return. Buying at 7x and selling at 9x creates multiple expansion; buying at 11x and selling at 9x destroys it.
Step 5 — Return Metrics
PE sponsors measure LBO success through two primary lenses:
- IRR (Internal Rate of Return) — Measures return accounting for time. A dollar returned in year 2 is worth more than a dollar returned in year 6. Limited partners increasingly seek more than 20% net IRR for top-quartile buyout funds, per Bain's Global Private Equity Report
- MOIC (Multiple on Invested Capital) — Measures total return regardless of timing. Bain models 2.5x MOIC over five years as the current target, requiring 10–12% annual EBITDA growth. Top-quartile buyouts have historically averaged 2.7x MOIC
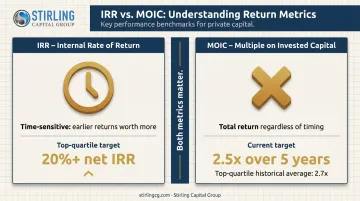
Both metrics matter. A 3x MOIC achieved over 10 years produces a far lower IRR than the same multiple achieved in 4 years. Understanding how these return drivers interact — debt paydown, EBITDA growth, and multiple expansion — shapes how sponsors structure the deal from day one.
How Are LBOs Financed?
LBO capital structures are layered — each layer carries different risk levels, interest rates, and repayment priority. Senior lenders get paid first and carry the least risk; equity holders get paid last and absorb the most.
Senior Debt
Senior secured debt forms the foundation of most LBO capital stacks, typically including:
- Term Loan A (TLA) — Amortizing loans, typically held by banks
- Term Loan B (TLB) — Institutional loans with minimal amortization, sold to CLOs and credit funds
- Revolving credit facility — Working capital line available post-close
The broadly syndicated leveraged loan market is now over 90% covenant-lite, meaning borrowers face fewer ongoing financial maintenance tests — a structural advantage for sponsors managing post-acquisition operations.
In 2024, average U.S. LBO total debt ran at 5.2x EBITDA, with first-lien debt at 4.9x and second-lien at 0.14x, per PitchBook LCD.
Mezzanine and High-Yield Debt
Mezzanine debt sits between senior debt and equity. It carries higher interest rates — compensating lenders for their subordinated position — and sometimes includes equity warrants or conversion features. For larger transactions, high-yield bonds (sometimes called junk bonds) serve a similar function, accessed through capital markets rather than direct lending relationships.
Equity Contribution
The PE sponsor funds the remaining portion through committed equity from their fund. In 2024, the average equity contribution was 48% of the purchase price — higher than pre-2022 norms, reflecting increased borrowing costs. Sellers sometimes retain a minority equity stake through a rollover, which aligns incentives and reduces the cash equity required from the sponsor.
A Note on Private and Alternative Lenders
For transactions below $250 million, a large share of LBO debt comes from non-bank private credit funds, direct lenders, and specialty finance sources — not traditional banks. Direct lending provided 90% of U.S. middle-market buyout loan issuance by end-2024, up from 36% a decade earlier.
For middle-market buyers assembling multi-tranche financing outside traditional banking channels, Stirling Capital Group provides access to over 60 private lending sources spanning senior secured lenders, private credit funds, mezzanine providers, and equity capital. That breadth allows buyers to address multiple layers of an LBO capital stack through a single advisory relationship.
What Makes a Good LBO Candidate?
The CFA Institute identifies recurring revenues and predictable cash flows as the defining characteristics of strong LBO candidates. High debt loads require consistent debt service — cash flow volatility is the fastest path to a covenant breach.
Strong LBO candidates typically share:
- Stable, predictable free cash flows with minimal revenue cyclicality
- Defensible market position with pricing power
- Consistent EBITDA margins across business cycles
- Tangible assets (receivables, inventory, equipment, real estate) that support collateral-based lending
- Strong management team, particularly in MBO scenarios
- Identifiable operational improvement opportunities post-acquisition
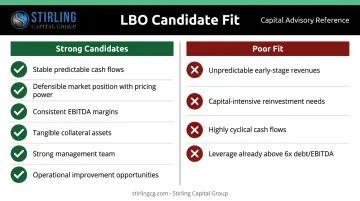
Businesses that struggle in LBO structures include:
- Early-stage or high-growth businesses with unpredictable revenues
- Capital-intensive businesses requiring heavy reinvestment that competes with debt service
- Companies in highly cyclical industries with dramatic cash flow swings
- Businesses with leverage already above the Federal Reserve's guidance threshold of 6x total debt/EBITDA, which regulators treat as a concern level for most industries
These candidate criteria don't exist in isolation — they map directly to how regulators and lenders underwrite the deal. The OCC's leveraged lending framework evaluates transactions on borrower leverage, repayment capacity, enterprise value support, and collateral. Understanding where a target company sits on each dimension shapes which lenders will engage and on what terms.
Benefits and Risks of Leveraged Buyouts
Benefits
For buyers:
- Leverage amplifies equity returns — a sponsor contributing 30% equity who achieves moderate EBITDA growth can earn multiples of their initial investment
- Debt service creates operational discipline, forcing management to prioritize cash flow efficiency
- Buyers can acquire significantly larger companies than they could fund with equity alone
For sellers and management:
- MBOs give management teams a path to ownership without needing full purchase-price capital upfront
- OBO structures allow existing owners partial liquidity while retaining equity upside in the next growth phase
- Seller rollovers let owners participate in post-acquisition value creation
Risks
The upside potential comes with a structural downside: high debt loads leave little margin for error. The U.S. leveraged loan default rate ran at 5.0–5.5% in 2024, per Fitch Ratings — and while that data covers leveraged loans broadly rather than LBOs specifically, it illustrates how quickly credit stress compounds when cash flows disappoint.
Three additional risks define most LBO failures:
- Paying 11x EBITDA on optimistic projections works until EBITDA misses — at which point the effective entry multiple gets worse retroactively
- Credit market tightening or rising rates before debt matures can make refinancing expensive or simply unavailable
- Aggressive post-acquisition cost-cutting can damage employee morale, customer relationships, or the business quality that justified the purchase price in the first place
Why Traditional Bank Financing Falls Short for LBOs
The mismatch between bank underwriting and LBO requirements is structural, not incidental.
Traditional banks are regulated institutions that underwrite on collateral, conservative leverage ratios, and predictable repayment schedules. The Federal Reserve's Interagency Guidance on Leveraged Lending treats debt above 6x total debt/EBITDA as a concern level for most industries. LBOs routinely operate at 5–6x leverage, and the regulatory scrutiny that follows makes bank balance sheets an uncomfortable home for these loans post-origination.
That structural tension created an entire alternative lending ecosystem. Private credit funds, direct lenders, CLO investors, and specialty finance sources now provide the speed, covenant flexibility, and risk appetite that LBO transactions require — particularly in the middle market, where deals are too complex for single-bank lending but too small for large institutional bond markets.
Key reasons traditional banks consistently fall short for LBOs:
- Leverage limits: Regulatory guidance flags most deals above 6x debt/EBITDA, a threshold LBOs routinely cross
- Covenant rigidity: Banks require maintenance covenants that conflict with the operational restructuring LBOs often involve
- Hold capacity: Banks face balance sheet constraints that make holding large, illiquid leveraged loans increasingly difficult
- Timeline friction: Bank credit committees and regulatory review cycles rarely match the compressed timelines of competitive acquisitions
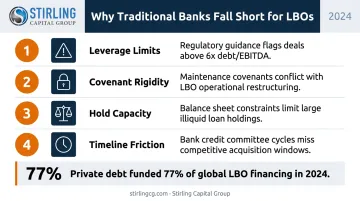
Private debt has moved from workaround to primary channel: it funded 77% of global LBO financing in 2024, compared to 23% from banks.
For business owners, investors, and buyers navigating an acquisition that requires flexible, non-traditional financing, the practical question is how to access that ecosystem efficiently. Stirling Capital Group operates as a commercial finance consultant with pre-authorized relationships across 60+ private lending sources — enabling substantive pre-qualification and pre-underwriting work before a borrower ever sits across from a lender. That early-stage work compresses the timeline that often determines whether a deal closes or collapses. Stirling offers a free consultation for buyers structuring acquisition financing across the continental U.S., major Canadian cities, and Puerto Rico.
Frequently Asked Questions
Is LBO the same as private equity?
LBO is a transaction strategy — a financing method for acquisitions. Private equity refers to the type of investor or fund that commonly executes them. PE firms are the most frequent LBO buyers, but not every LBO involves a PE firm; MBOs by management teams are a clear example.
What is the difference between M&A and LBO?
M&A is a broad category covering any merger or acquisition. An LBO is a specific subset where the buyer finances the majority of the purchase price with debt. All LBOs are M&A transactions — but most M&A deals are not LBOs.
How is LBO different from DCF?
DCF (Discounted Cash Flow) is a valuation method used to estimate a company's intrinsic value. An LBO is a transaction and financing structure. DCF analysis may be used within LBO modeling to assess value, but the two serve entirely different purposes.
What makes a good LBO candidate?
Ideal targets have stable, recurring cash flows, established market positions, tangible collateral assets, and clear operational improvement opportunities. Mature businesses in non-cyclical industries qualify far more consistently than early-stage or high-growth companies.
What is a typical debt-to-equity ratio in an LBO?
Historically, debt has comprised 50–70% of the total purchase price. In 2024, the average equity contribution was 48%, per PitchBook LCD — reflecting higher borrowing costs pushing sponsors to put in more equity than in the low-rate era of 2015–2021.
How long do PE firms typically hold an LBO investment before exiting?
The median holding period for buyout-backed exits was 6.1 years in 2024, per Bain's Global Private Equity Report, with averages reaching approximately seven years by 2025 — and nearly 40% of companies held more than five years.