
What makes PE leverage distinct from ordinary corporate borrowing is its structure. It's purposeful, time-bound, and built around a specific investment thesis—not general working capital needs. And it operates at two distinct levels that even sophisticated investors often conflate: the fund itself, and the portfolio companies it owns.
This article covers both levels of PE leverage, how they affect returns and risk, what's changed in the post-2022 rate environment, and what business owners and investors need to understand before engaging with PE-backed capital.
Key Takeaways:
- PE leverage operates at two levels—fund and portfolio company—with different risk and performance implications
- Leverage amplifies both returns and losses; the same mechanics work in both directions
- Subscription credit facilities and NAV loans affect reported IRR without changing actual cash-on-cash returns
- Rising interest rates since 2022 have forced sponsors to write larger equity checks and restructure deal financing
- Business owners and LPs should look beyond headline IRR when evaluating PE-backed capital structures
What Is Leverage in Private Equity?
PE leverage means borrowing capital to control a larger asset than equity alone could support, with the expectation that returns will exceed the cost of debt.
The Basic Mechanics
Consider two scenarios with the same $10M equity investment:
- Scenario A (unlevered): You invest $10M equity to acquire a $10M business. If it grows to $15M, your return is 50%.
- Scenario B (levered): You invest $10M equity alongside $40M in debt to acquire a $50M business. If it grows to $60M and you repay the $40M debt, your equity is worth $20M—a 100% return on the same $10M investment.
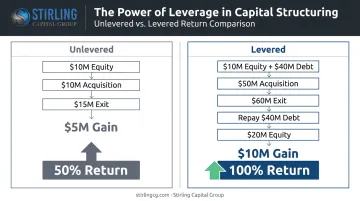
The debt didn't change the underlying business. It changed how much the equity holder captures.
How PE Firms Measure Leverage
PE lenders and sponsors use debt-to-EBITDA as the primary leverage metric—essentially, how many years of operating earnings it would take to repay the debt. This matters more in buyout financing than traditional debt-to-equity ratios because it ties leverage directly to cash flow coverage.
According to PitchBook/LCD, average LBO debt/EBITDA reached 5.9x in 2022, dropped to a 13-year low of 4.9x in 2023, then recovered to 5.2x in 2024.
Those fluctuations matter because debt availability directly shapes what PE firms can afford to pay — and what they can return to investors.
Why PE Firms Prioritize Leverage
Debt is generally cheaper than equity, but that's not the only reason PE firms rely on it. Leverage compresses the equity required per deal, which means:
- More investments per fund
- Higher IRR on a smaller equity base
- Ability to meet return targets within a defined fund life (typically 10 years)
Most PE funds target 20%+ IRR for LP investors — a threshold that's difficult to reach on equity alone, which is why leverage remains central to buyout strategy regardless of the rate environment.
Fund-Level vs. Portfolio Company Leverage: What's the Difference?
LPs, co-investors, and fund managers often treat portfolio company debt and fund-level borrowing as interchangeable. They aren't. Each sits at a different point in the capital structure, responds to different risks, and distorts performance metrics in different ways — understanding the distinction is foundational to evaluating any PE fund's true risk profile.
Portfolio Company Leverage (LBO Debt)
In a leveraged buyout, debt is placed on the acquired company's balance sheet—not the fund's. The company's own cash flows and assets serve as collateral. Term loans, revolvers, and second-lien notes all sit at this level.
With 2024 average LBO debt/EBITDA at 5.2x and interest coverage averaging just 2.34x, the cash flow math is tight: for every dollar of operating earnings, companies are left with roughly 43 cents after debt service.
Fund-Level Leverage: Subscription Credit Facilities
Rather than borrowing against portfolio companies, GPs can borrow against LP capital commitments. These subscription lines let funds deploy capital immediately without calling equity from investors.
ILPA has established that short-duration facilities—cleared every 90 days—represent standard operational usage. When facilities remain open for 180+ days or exceed 20% of committed capital, IRR inflation becomes a real concern: reported IRR rises without any change in actual cash-on-cash returns, because the equity investment period appears shorter than it actually was.
ILPA recommends funds disclose IRR both with and without the subscription facility so LPs can assess the real picture independently.
Fund-Level Leverage: NAV-Based Lending
After the investment period closes, funds can borrow against the net asset value of existing portfolio holdings. The NAV lending market has grown to approximately $150 billion and is projected to double by 2027, according to Bain & Company.
NAV facilities serve several purposes:
- Funding follow-on investments without new capital calls
- Providing liquidity to LPs who want distributions
- Supporting portfolio companies under stress
The tradeoff: higher NAV leverage introduces asset-coverage covenant risk. If portfolio valuations fall, borrowing capacity shrinks and covenants can breach.
The Core Distinction
| Portfolio Company Leverage | Fund-Level Leverage | |
|---|---|---|
| Collateral | Company assets and cash flows | LP commitments or portfolio NAV |
| Sits on | Target's balance sheet | Fund's balance sheet |
| Affects | Underlying investment returns | Reported IRR and fund liquidity |
| Primary risk | Operational flexibility, default | IRR inflation, covenant breach |
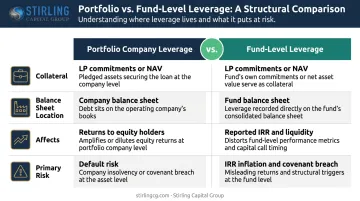
LPs and co-investors should model each level independently during due diligence. Portfolio company leverage tells you about operational risk; fund-level leverage tells you whether the reported returns reflect actual investor experience.
How Leverage Drives Returns—and Amplifies Risk
The Return Side
MSCI research found that U.S. and Western European buyout funds delivered 15.4% annualized net returns over the prior decade, versus 10.9% for comparable public-market benchmarks. Leverage is a meaningful contributor to that gap—U.S. buyout companies historically carried more than 25% excess leverage relative to public-market peers.
Leverage amplifies returns through two channels:
- Reducing equity required per deal (same gains, smaller denominator)
- Concentrating cash flow appreciation on equity after debt service
The Risk Side
The mathematics that boost upside work identically in reverse. If a leveraged company's value drops, equity absorbs all the losses first—debt is senior. A company acquired at 6x EBITDA with 5x debt leverage has almost no equity cushion against a modest revenue decline.
Beyond valuation, high leverage restricts what companies can do operationally:
- Cash flows are committed to debt service, not reinvestment
- Covenant violations can trigger lender intervention or forced asset sales
- Options narrow when capital is unavailable
Interest Rate Sensitivity
Most LBO debt is floating-rate, tied to SOFR. The post-2022 rate environment showed exactly how painful this can be.
PitchBook/LCD data tracks the climb in average LBO loan yield-to-maturity:
| Period | Avg. LBO Loan YTM |
|---|---|
| Q1 2021 | 4.70% |
| Q3 2022 | 9.86% |
| Through 2024 | ~9.5% |
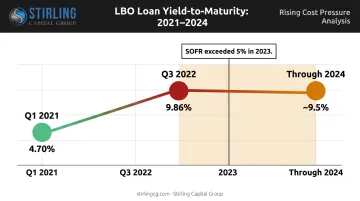
By 2023, three-month SOFR exceeded 5%. New-issue LBO interest coverage fell to 2.3x, the tightest reading since 2007. Fitch revised its 2024 U.S. leveraged loan default-rate estimate to 5.0–5.5%, reflecting cumulative pressure on levered balance sheets.
Sector Differences
Not all sectors absorb leverage equally. MSCI data shows information technology and healthcare carry particularly elevated leverage relative to public peers. Asset-light, high-growth businesses can support higher debt multiples because lenders bet on future cash flows rather than tangible collateral. Sectors with predictable, recurring revenue—software and specialty healthcare, for example—tend to attract the most aggressive leverage structures.
Key factors that determine how much leverage a sector can carry:
- Revenue predictability: Recurring or contracted cash flows reduce lender risk
- Asset intensity: Tangible assets provide collateral; intangible-heavy businesses rely on growth projections
- Margin stability: High-margin businesses can service debt even through revenue dips
- Capital expenditure requirements: Heavy reinvestment needs compete directly with debt service
Leverage Trends and What They Mean Today
Post-2022 Structural Shifts
The low-rate era made high-leverage LBOs the default structure. That changed quickly. With borrowing costs doubling in roughly 18 months, PE sponsors had limited options:
- Lower leverage: Average LBO debt/EBITDA dropped to a 13-year low of 4.9x in 2023
- Larger equity checks: Equity contributions reached 51% of deal value in 2023 and remained at 48% in 2024—historically elevated levels
- Reduced deal activity: Buyout investment volume fell 37% from 2022 to 2023, reaching its worst level since 2016
The 2024 recovery was real but partial—U.S. LBO transaction volume rose to $162 billion from $134 billion in 2023, while financing costs stayed elevated at 9.5% average yield-to-maturity.
The Rise of NAV Lending
As traditional LBO leverage became more expensive, fund-level NAV lending gave GPs a way to generate distributions and fund follow-ons without forcing portfolio company sales at depressed valuations.
17Capital reported NAV financing deal volume grew from $1.5 billion in 2020 to $2.8 billion in 2021, and the broader market has since reached approximately $150 billion.
LP reception has been mixed. Bain's research found only about 40% of LPs were neutral to positive on NAV loan use. Many view it as opaque and potentially misaligned—it can obscure a fund's true liquidity position and layer on leverage that LPs never underwrote.
Alternative Deal Structures
When conventional leverage was too expensive, sponsors turned to creative financing. Common structures included:
- PIK (payment-in-kind) interest — defers cash outflows by accruing interest to principal
- Seller financing — keeps part of the purchase price off the bank's books
- Earnouts — ties deferred consideration to future performance targets
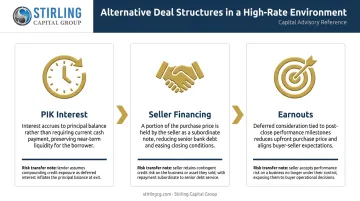
These arrangements let deals close at prices that couldn't be financed conventionally, but each transfers a different risk profile to all parties involved.
What Business Owners and Investors Should Know
For Business Owners Considering a PE Sale
When a PE firm acquires your company using leverage, that debt doesn't disappear—it lands on your company's balance sheet. Practically, this means:
- Free cash flow gets redirected to debt service, not reinvestment or distributions
- Financial covenants can restrict hiring, capex, acquisitions, or dividends
- The fund's exit timeline is partly dictated by the debt maturity schedule
- Operational decisions increasingly involve the lender, not just the PE sponsor
Before accepting PE-backed capital, understand the proposed debt/EBITDA multiple, the interest rate structure (fixed vs. floating), and what covenants will constrain the business post-close. With 2024 average LBO interest coverage at just 2.34x, there is limited room for revenue shortfalls.
For LP Investors Evaluating PE Funds
Headline IRR is an incomplete picture when subscription credit facilities are in use. Key questions to ask your fund manager:
- Does the fund report IRR both with and without the subscription facility?
- What is the maximum duration and size of subscription line usage allowed in the fund documents?
- Is NAV borrowing permitted, and under what conditions?
- What are the underlying portfolio company debt/EBITDA levels?
MOIC (multiple on invested capital) and DPI (distributions to paid-in capital) are harder to manipulate than IRR because they measure actual cash returned—not the timing of when equity was technically deployed. In funds with active subscription line usage, these metrics often tell a clearer story.
Alternative Capital Structures
For business owners evaluating PE buyouts alongside other options, the debt structure is just one variable. Alternative capital arrangements—including private credit, asset-based lending, mezzanine financing, and hybrid debt/equity structures—can offer more flexibility depending on your business's cash flow profile and growth stage.
Stirling Capital Group works with middle-market companies and business owners across the US to identify and place capital from a network of 60+ private lending sources — spanning private credit, asset-based lending, mezzanine, and hybrid structures. As a capital advisory firm (not a direct lender), they evaluate multiple financing paths rather than fitting you into a single credit box. A free initial consultation is available at stirlingcg.com or by calling 614-470-4716.
Frequently Asked Questions
What is fund-level leverage in private equity?
Fund-level leverage means borrowing at the fund itself, not at the portfolio company level. It takes two forms: subscription credit facilities (secured by LP capital commitments) and NAV-based lending (secured by portfolio holdings). Both are used to manage capital call timing, boost IRR optics, or fund follow-on investments.
What is the 80/20 rule in private equity?
In PE, the 80/20 split most commonly refers to carried interest: LPs receive 80% of profits above the hurdle rate, while GPs keep the remaining 20% as their performance fee. It can also describe a general return pattern—roughly 20% of portfolio companies tend to generate around 80% of a fund's total returns.
How does leverage affect IRR in private equity?
Leverage boosts IRR by reducing the equity invested per deal, concentrating returns on a smaller base. Subscription credit facilities further inflate reported IRR by delaying when capital is formally called, making the investment period appear shorter without changing the actual cash-on-cash multiple (MOIC) returned to investors.
What is a subscription credit facility in a PE fund?
A subscription credit facility is a short-term revolving line of credit secured against LP capital commitments, not portfolio assets. GPs use them to fund investments immediately and batch capital calls for efficiency. When held beyond 180 days, they function primarily as an IRR management tool rather than an operational bridge.
What are the key risks of high leverage in a PE-backed company?
The main risks include fixed debt service obligations that persist even when revenues fall, covenant breach risk that can trigger lender control or forced asset sales, restricted capital for reinvestment and growth, and heightened default exposure in high-rate environments. With 2024 average LBO interest coverage at 2.34x, the margin for error is narrow.